
Traffic
Traffic data when you need it.
Volumes, speeds and congestion across the whole street network, every day of the year.
Traffic map
Speeds and congestion, weekday afternoon
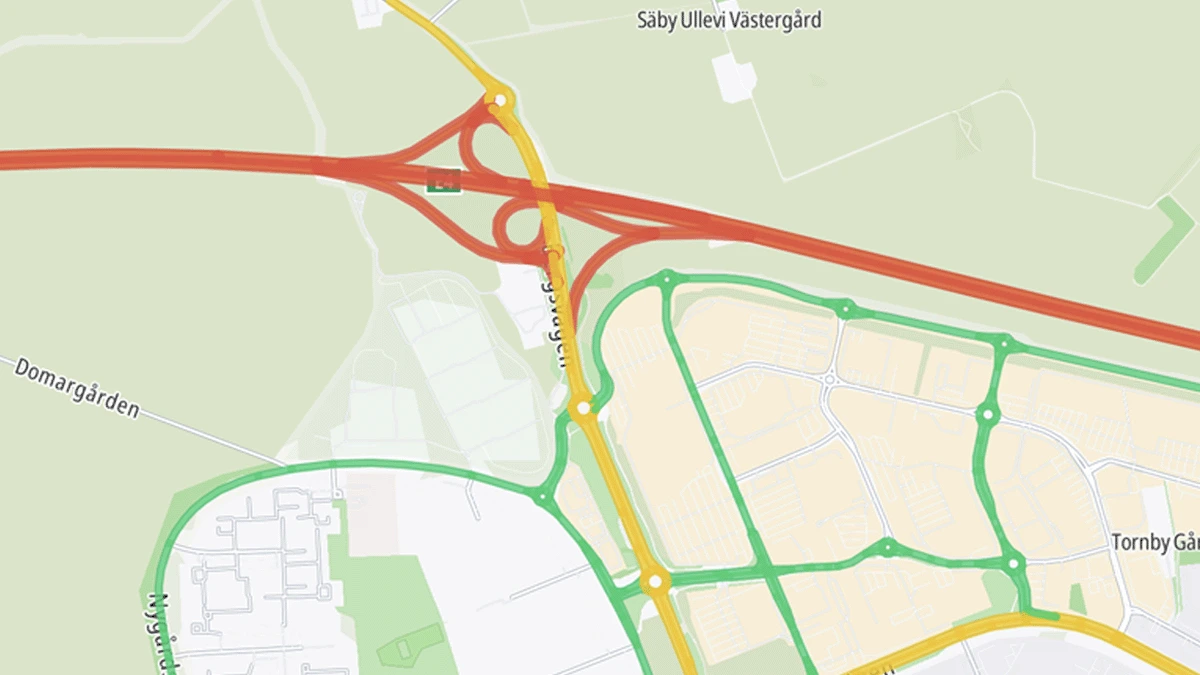
Citywide coverage
Every street, every day.
Traffic data across the whole street network throughout the year, without installing sensors. When a new need comes up, the data is already there.
Traditional measurement
Selected locations · Limited measurement period
Citylytics
Full street network · All year
Traffic data
The metrics you already use.
Available across the whole street network, every day of the year.
Traffic volumes
Vehicles per hour and annual average daily traffic (AADT) for every street segment.
Speeds
Actual driving speeds by segment and hour, next to the posted limit.
Speed compliance
Where and when speeds regularly exceed the limit.
Congestion
Where and when traffic slows down, how long it lasts and how it develops over time.
Patterns by street and time
Hourly and weekday profiles for each street, with peak hour and load factor.
Heavy vehicles
Where heavy vehicles travel and how their flows vary through the day.
Compare over time
Choose the period you need.
Move between individual hours, days, weeks and seasons in the same view.
Bridge Street
Traffic volume
Busiest hour 17:00, 1,520 veh/h
Vehicles per hour on an average weekday.
Before & after
Measure what changed.
Compare the same streets and time periods before and after a street change, new development or other intervention.
Bridge Street
Before and after the new speed limit
Before and after
Change -22%
Six weeks before and six weeks after the new speed limit. Average daily traffic per week.
- Before
- After
Analysis & reporting
Analyse the data. Create the report.
Analyse annual traffic patterns, assess development projects and evaluate interventions, then create a report ready to share with colleagues and decision makers.
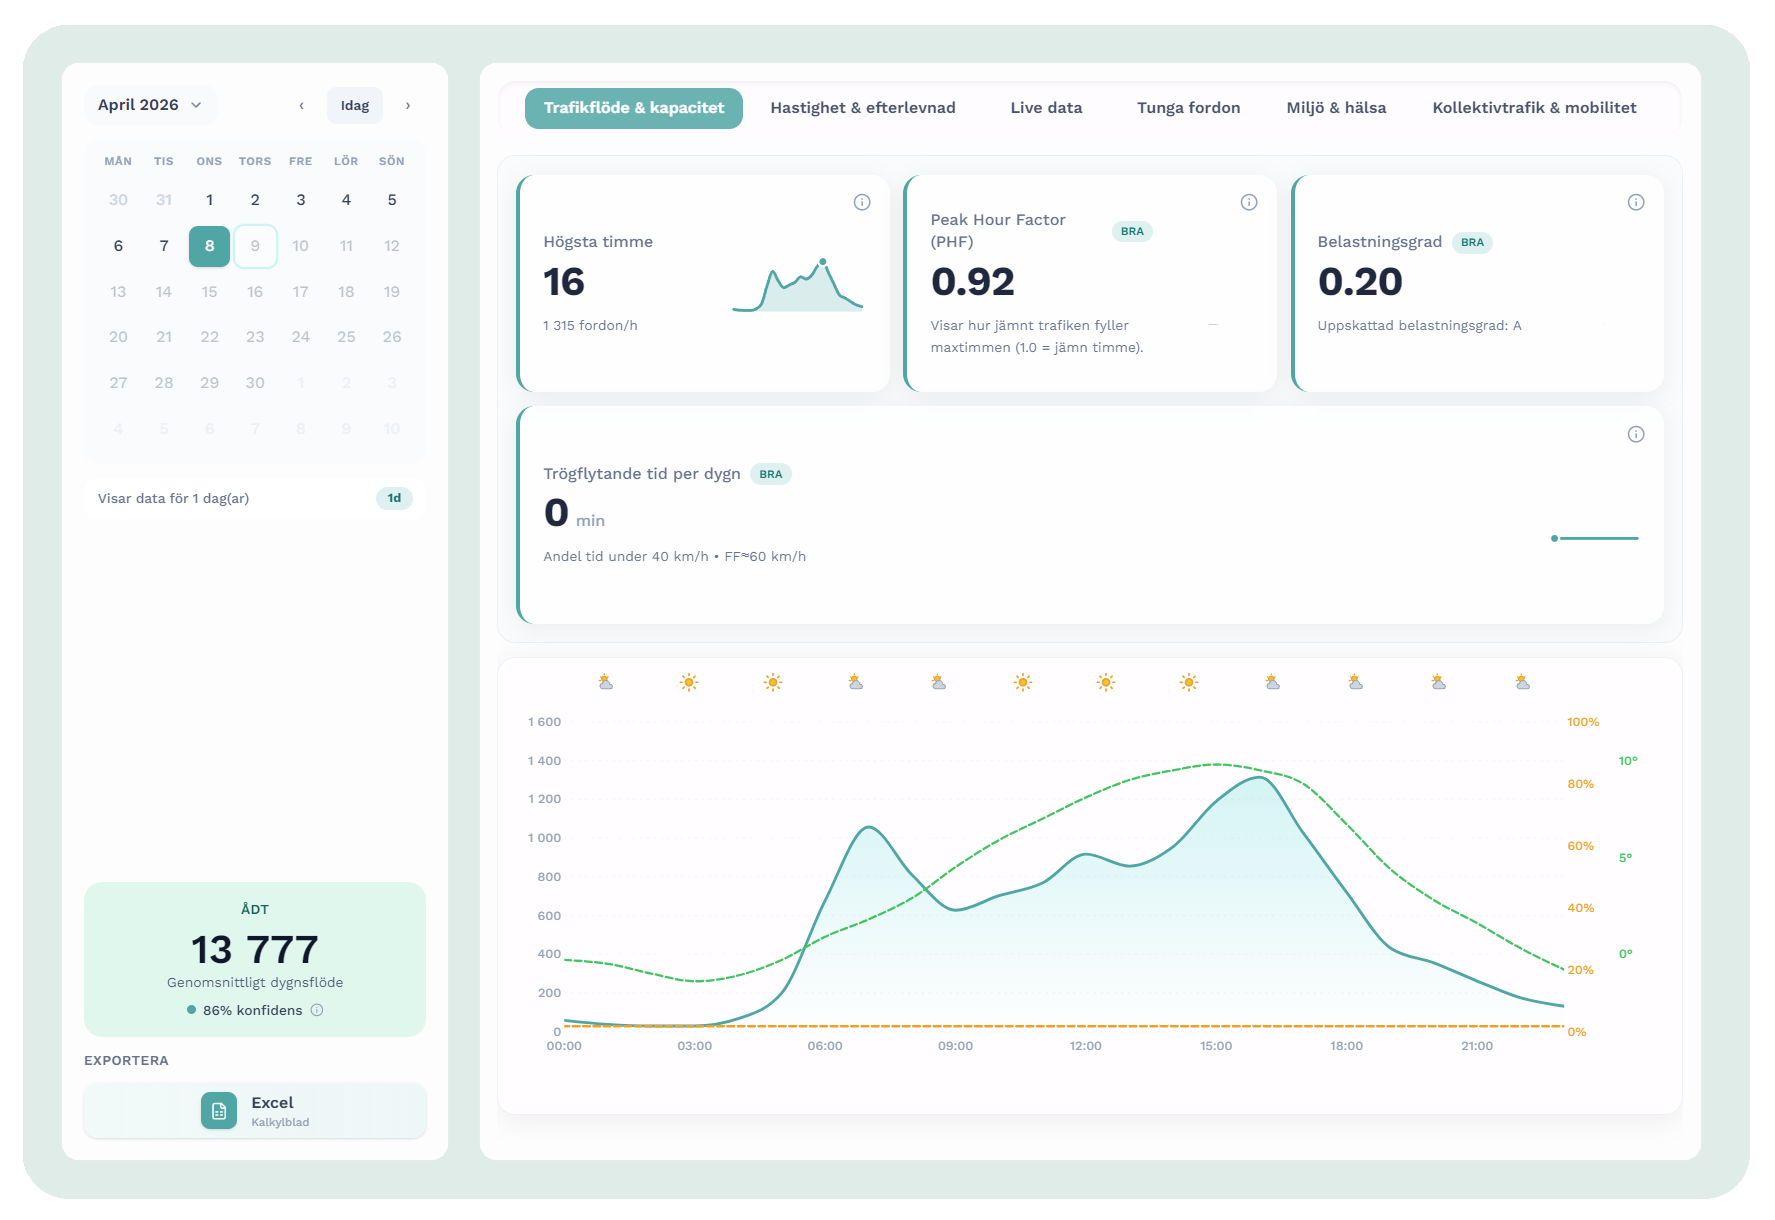
Analyse the data
Follow the traffic situation, a project area or a change over time, in the same view.
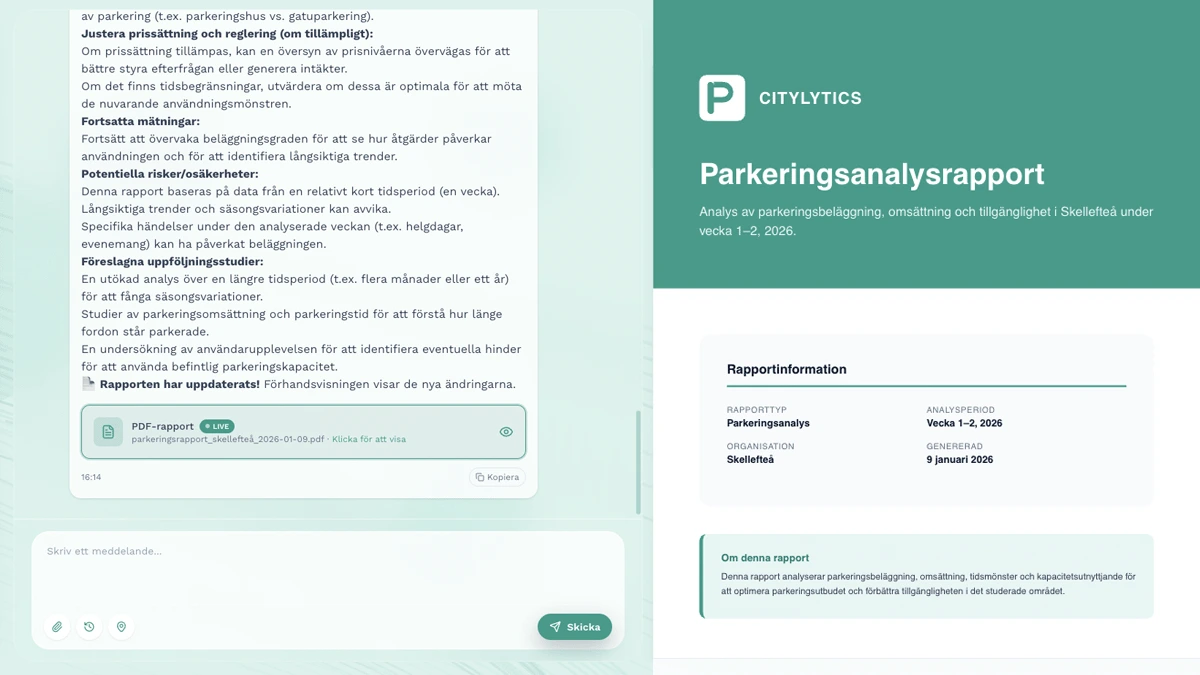
Create the report
Generate a report from the analysis you are looking at and adjust it in Citylytics.
Export and share the result
Export the finished report and share it with colleagues, managers and decision makers.
Traffic analysis
Selected street, one day
Report
Generated from the analysis
Simulation
Test the change before you make it.
Explore how traffic could change after a street redesign, speed limit change or new development.
Traffic scenario
Today next to the scenario
Traffic regulations
Keep track of local traffic regulations.
See where regulations apply, review overlaps or inconsistencies, and follow new or changed regulations as they are added.
Local traffic regulations
Selected area
Regulations that apply on the selected street
See your whole street network in Citylytics.
Get a walkthrough focused on the streets, areas and questions that matter most to your city.
Book a walkthrough
No preparation required. We tailor the walkthrough to your questions.