
Public transport
See the whole network as it runs.
See current conditions across the whole network on one map. Explore vehicles, segments and stops without relying solely on operator reporting.
Live network
Current conditions, selected stop
Historical view
Same network, earlier period, selected segment
Weekday, morning peak
History
Past and present, same view.
Move between live and historical views to analyse vehicles, segments, stops and disruptions in the same interface.
- 01
Start from the current network
Begin with what is happening now: which vehicles are running, which segments are slow and where alerts are active.
- 02
Step back to an earlier period
Use the time control to move to a previous day or time of day and see the same network, stops and segments as they were then.
- 03
Compare and investigate
Put periods side by side to understand whether a delay is a one-off or a pattern, and what changed before and after.
Delays & disruptions
Find where delays build up.
Delay hotspots, heat maps and alerts bring recurring problems and disruptions into the same view.
Delay heat map
Segments coloured by delay, hotspots highlighted
Delay hotspots
Find the segments and places where delays repeatedly accumulate between stops.
Heat maps
See conditions across the network at a glance and explore how patterns change through the day.
Alerts
Review disruptions in the same network context, both as they happen and when analysing previous periods.
Accessibility
Compare how well each area is served.
Compare public transport accessibility across the city based on walking distance to stops and service frequency. Citylytics turns this into a Public Transport Accessibility Level (PTAL) for each location, making areas easy to compare.
Used when
- Planning new development
- Comparing areas
- Reviewing parking requirements
Accessibility by area
PTAL per location, walking distance to stops
Planning & development
Put public transport in context.
Analyse public transport alongside traffic and parking when evaluating a street, neighbourhood or development area.
Public Transport
Service, delays and accessibility
Service, delays and accessibility
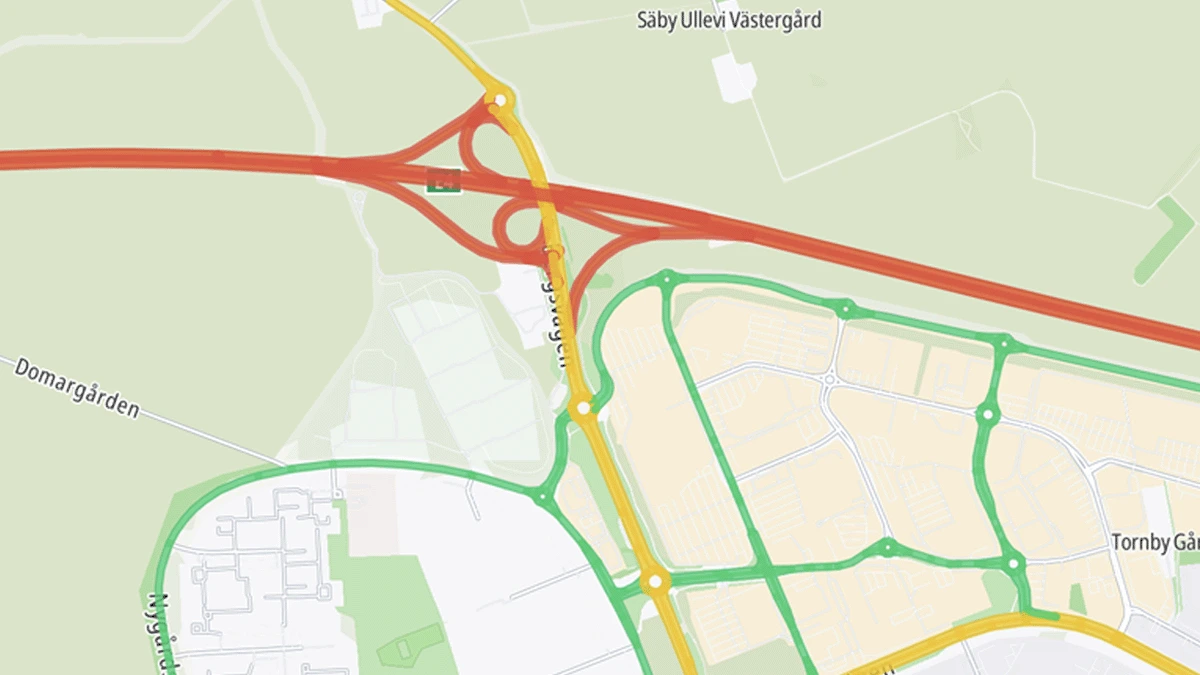
Traffic
Volumes, speeds and congestion
Volumes, speeds and congestion
Parking
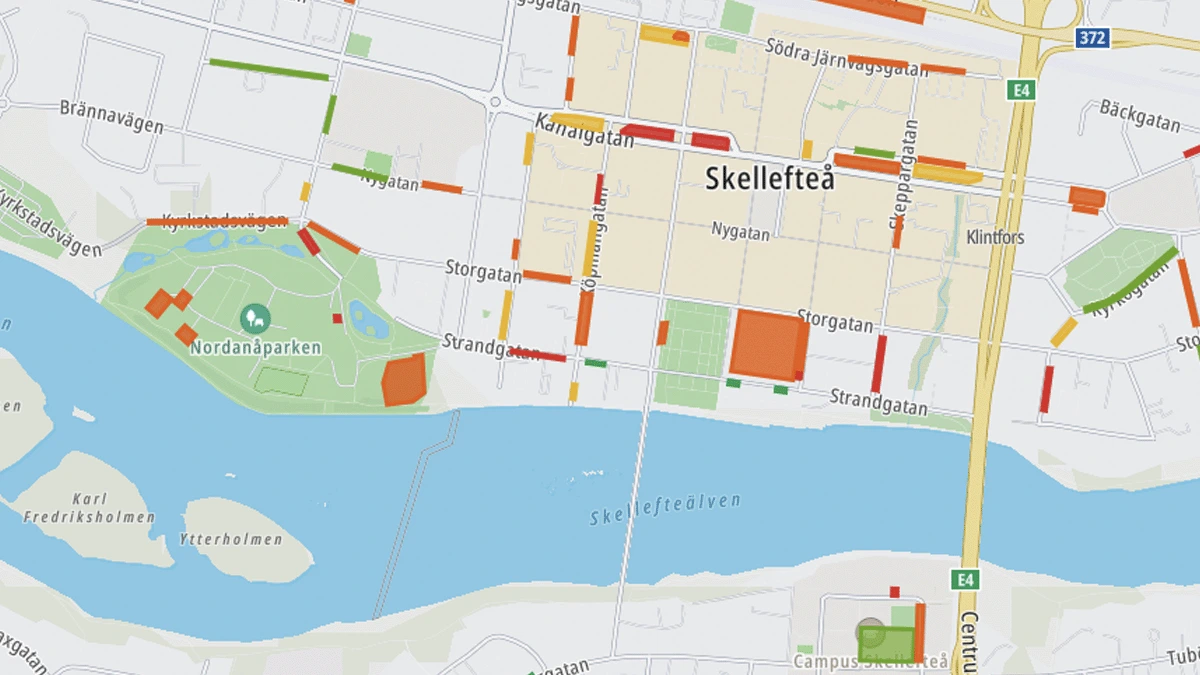
Occupancy, demand and capacity
Occupancy, demand and capacity
See your public transport network in Citylytics.
We tailor the walkthrough to the questions and areas most relevant to your work.
Book a walkthrough
No preparation required. We tailor the walkthrough to your questions.