
Parking
Know where parking fills up.
See occupancy and demand across parking facilities and on-street parking, hour by hour, all year. No sensors required.
Parking map
Occupancy, weekday midday
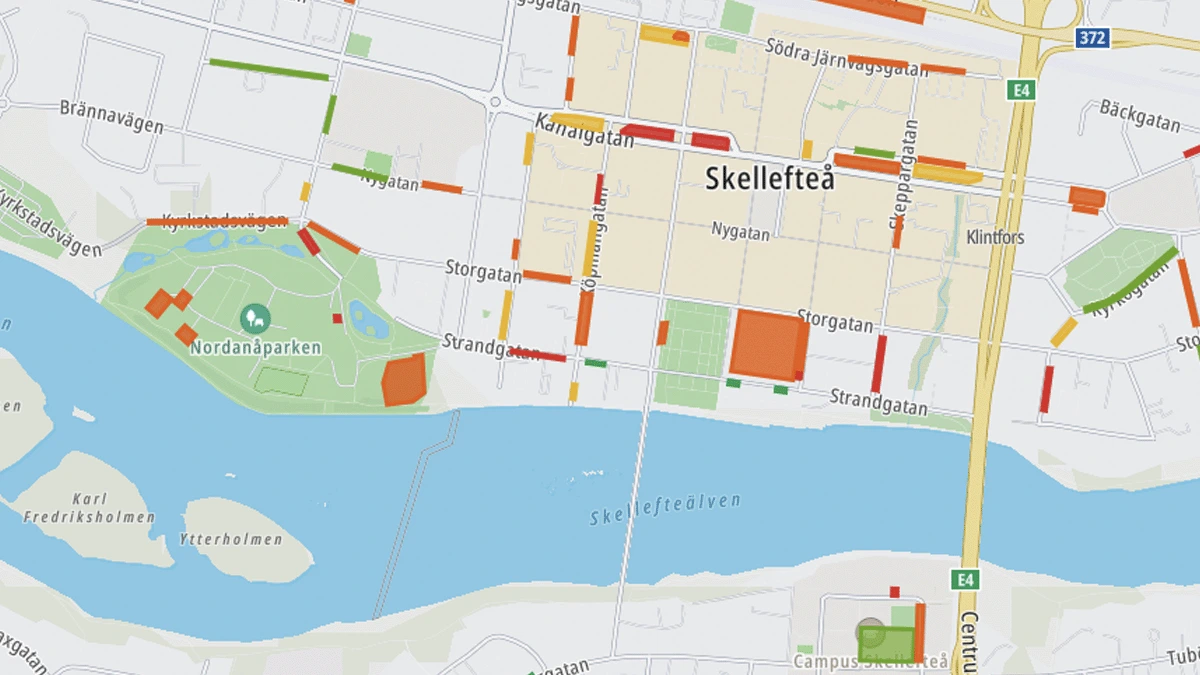
Citywide parking
See more of the parking you manage.
Occupancy and demand across parking facilities and on-street parking, without new sensors.
Typical coverage
Selected facilities · Surveyed streets
Citylytics
Facilities · Streets · Zones
Parking data
Understand occupancy, demand and capacity.
Occupancy
How full parking facilities, streets and zones are at a given time.
Demand
Where parking demand is highest and where available capacity remains.
Capacity & inventory
Parking capacity, parking types and other characteristics of the available supply.
Street, zone & facility views
Analyse individual streets, parking zones, facilities or larger areas.
Parking patterns
When and where is parking full?
See occupancy across parking facilities, streets and zones, hour by hour, across weekdays, weekends and seasons.
Centre zone
Occupancy by hour and weekday
Weekday lunch hours and Saturday midday are full. Evenings and Sunday have unused capacity.
QuietFull
Before & after
Measure what changed.
Compare parking demand and occupancy before and after a tariff change, new development, street redesign or other intervention.
Centre zone
Before and after the tariff change
Before and after
Average occupancy 96% → 83%
Six weeks before and six weeks after the new tariff. Average weekday occupancy, 10:00–16:00.
- Before
- After
Analysis & reporting
Analyse demand. Create the report.
Analyse parking patterns, compare areas and evaluate changes, then create a report ready to share with colleagues and decision makers.
Analyse the data
Explore occupancy, demand, capacity and patterns for the streets, facilities or areas relevant to the analysis.
Create the report
Generate a report from the parking analysis and adjust the content for the intended audience.
Export and share the result
Export the finished report and share it with colleagues, managers and decision makers.
Parking analysis
Selected area, weekday midday
Report
Generated from the analysis

Simulation
Test the change before you make it.
Explore how parking could change with different capacity, new zones or adjusted time limits.
Parking scenario
Today next to the scenario
Parking regulations
Keep track of local parking regulations.
See where parking regulations apply, review rules and restrictions by location, and follow new or changed regulations as they are added.
Local parking regulations
Selected area
Regulations that apply on the selected street
See where parking fills up in your city.
Get a walkthrough focused on the parking areas and questions that matter most to your city.
Book a walkthrough
No preparation required. We tailor the walkthrough to your questions.